November Market Update
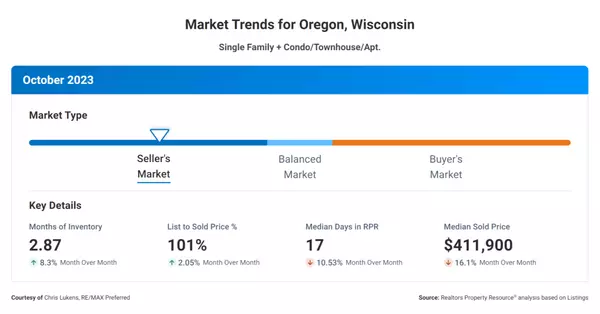
When it comes to real estate, there are several key metrics that buyers and sellers should be aware of in order to make informed decisions. Let's take a closer look at the correlation between these metrics and what they mean for the market. First, let's consider the Months Supply of Inventory, which currently stands at 2.87. This metric represents the number of months it would take to sell all existing homes on the market if no new listings were added. A lower number indicates a seller's market, where demand outweighs supply. In this case, with a relatively low supply of inventory, it suggests that there may be more buyers than available properties. Now, let's examine the 12-Month Change in Months of Inventory, which has increased by a significant 92.62%. This indicates that the supply of homes on the market has grown considerably over the past year. This could be due to various factors such as increased construction, higher number of listings, or decreased demand. It suggests that the market may be shifting towards a more balanced or buyer's market. Another important metric is the Median Days Homes are On the Market, which currently stands at 17. This represents the average number of days it takes for a home to sell once it's listed. A lower number suggests a fast-paced market with high demand. In this case, the relatively short time homes spend on the market indicates a strong buyer interest and a potential for quick sales. Â Moving on, let's consider the List to Sold Price Percentage, which is at 101%. This metric indicates how close the final sale price is to the initial listing price. A percentage above 100% suggests that homes are selling for more than their original asking price, which is a positive sign for sellers. It implies strong competition among buyers, potentially leading to bidding wars and higher sale prices. Lastly, we have the Median Sold Price, which currently stands at $411,900. This metric represents the middle point of all sold home prices, with an equal number of homes selling above and below this price. It provides an overview of the market's overall pricing trends. A higher median sold price suggests a more expensive market, indicating strong demand and potentially limited affordable options. In summary, the correlation between these real estate metrics suggests a market that is currently favoring sellers. With a low supply of inventory, short days on the market, and homes selling above their listing price, it indicates a high demand and competitive environment. However, the significant increase in the supply of homes over the past year may be an indication of a shifting market, potentially providing more options for buyers in the future. As always, it's essential for both buyers and sellers to stay informed and consult with a real estate professional to navigate these dynamics effectively.
Categories
Recent Posts